Maths Year 3
Bar charts and tables
Read and draw bar charts, pictograms and tables, and answer questions.
Curriculum objective
White Rose Maths Year 3, Summer block 5: Statistics (NC: interpret and present data using bar charts, pictograms and tables).
- When
- July
- School year
- Year 3
- Subject
- Maths
- Paper
- A4
- Language
- English
Inside this set
Example pages of each kind. In the studio the set draws its own, with its letters, numbers and words, in the theme you choose.
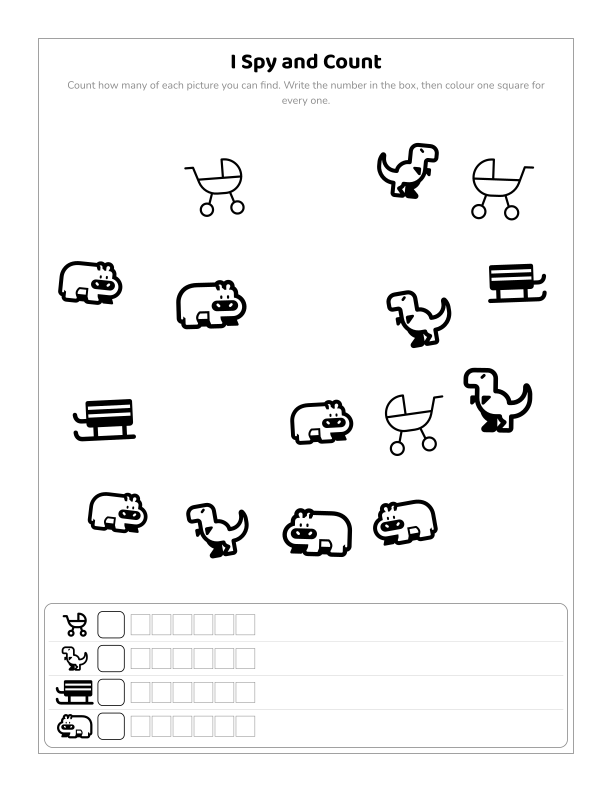
1I Spy and Count
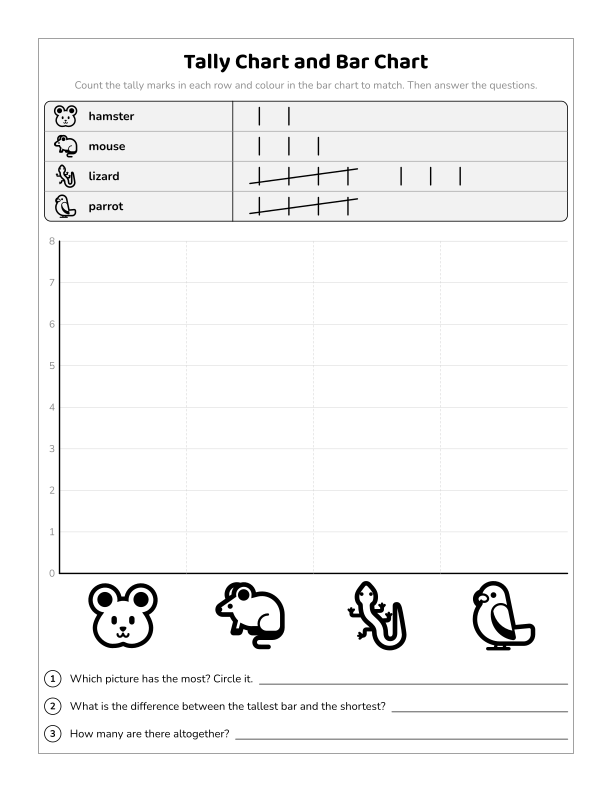
2Charts and Graphs
3Charts and Graphs