Charts and Graphs
Count a tally chart or a pictogram, draw the bar chart, then answer questions about it.
Data handling for the first years of school. Two of the layouts give a child data to gather — a tally chart of five-bar gates, or a pictogram of little pictures — and an empty bar chart with a ready-made scale to transfer it onto. The third gives a finished chart and asks questions about it: which is the most popular, how many more of one than another, how many altogether. The numbers behind all three are the same, so the questions and the answer key can never disagree with the picture.
- Age
- ages 5–9
- Answer key
- Included, free
- Skills
- countingarithmeticclassificationlogic
What you can change
What the page does
Tally to bar chart, Pictogram to bar chart, Read a chart, Count, tally and chart
How many things
3–6 bars
Biggest number
4–12
Label the bars with
Pictures, Words
Add questions
- Every page also takes the book's language, page size, theme and pictures.
Ready-made worksheets with this page
Used in 48 worksheet sets for the school year, each in its country's language.
🕒 Time, money and data
All activities →Clocks, calendars, coins, charts and chance.
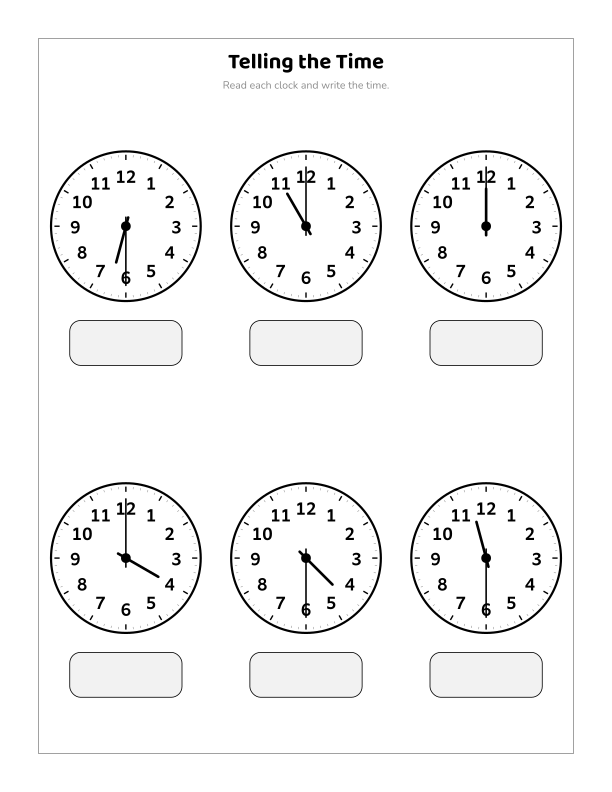
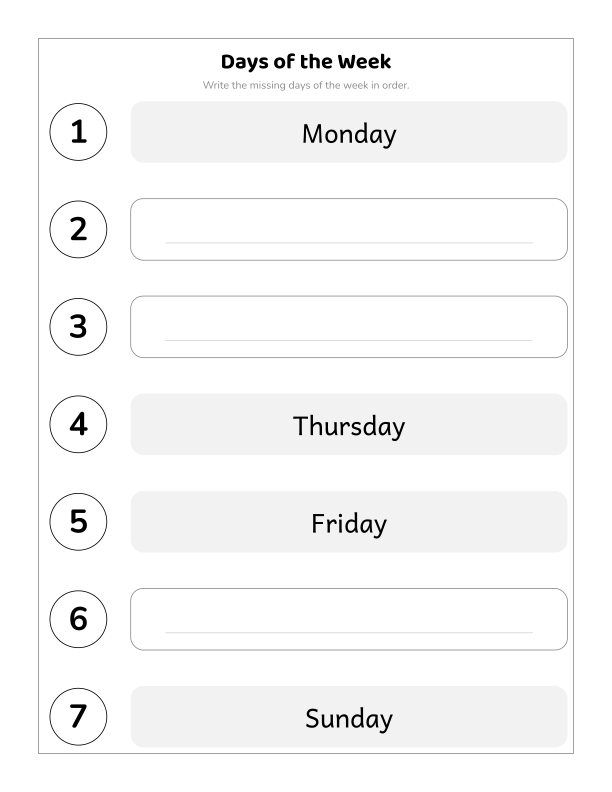
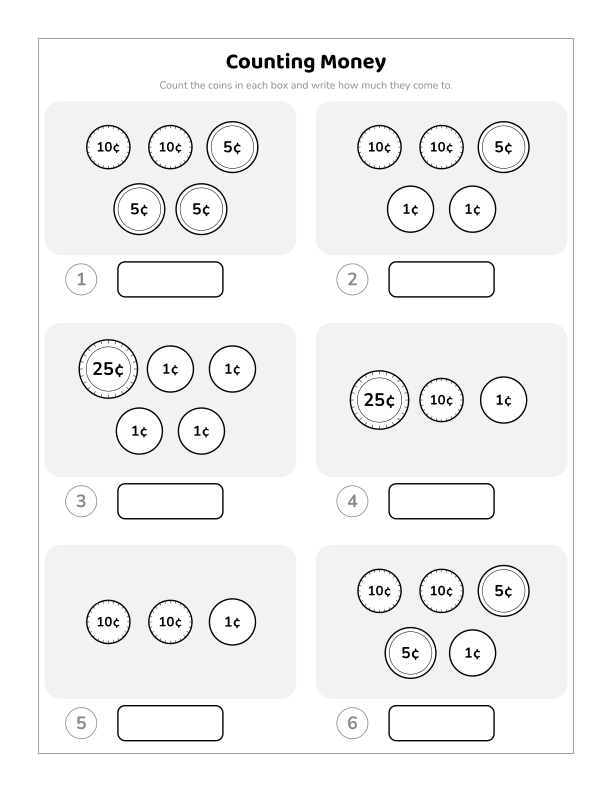
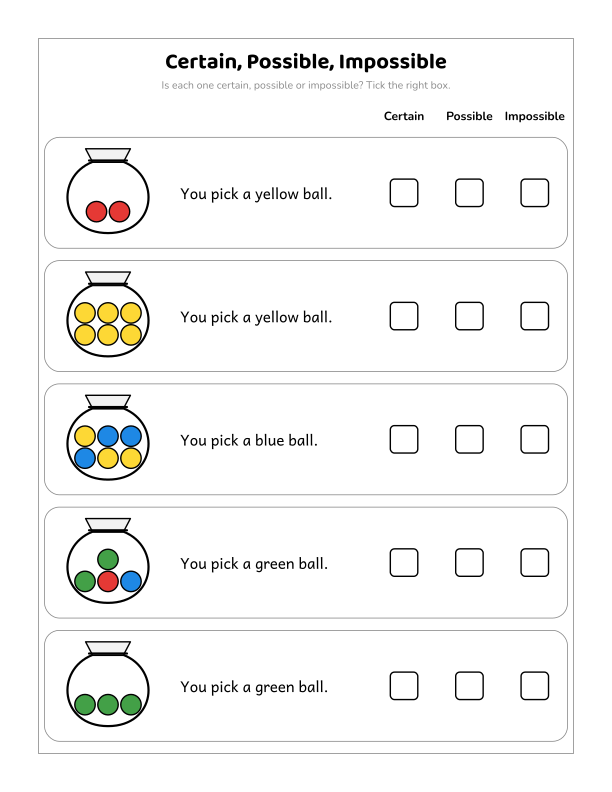
Put it in a book with other pages: covers, answer keys and a certificate are free.
Start building